

Austin, TX Cost of Living: A Detailed Guide to Housing Affordability in 2025
Published | Posted by Dan Price
Understanding the Cost of Living in Austin, TX: A Data-Driven Guide to Housing Affordability
Austin, Texas, is a dynamic city known for its thriving tech scene, vibrant culture, and rapid population growth. As more people consider relocating to this bustling hub, understanding the cost of living, particularly housing affordability, becomes essential. This article provides a detailed, data-driven analysis of Austin’s housing market, focusing on list prices, monthly payments, and income requirements across various percentiles of active listings. By integrating comprehensive housing data, this guide offers prospective residents a clear picture of what it takes to live in Austin, optimized for those searching for reliable information on the city’s cost of living.
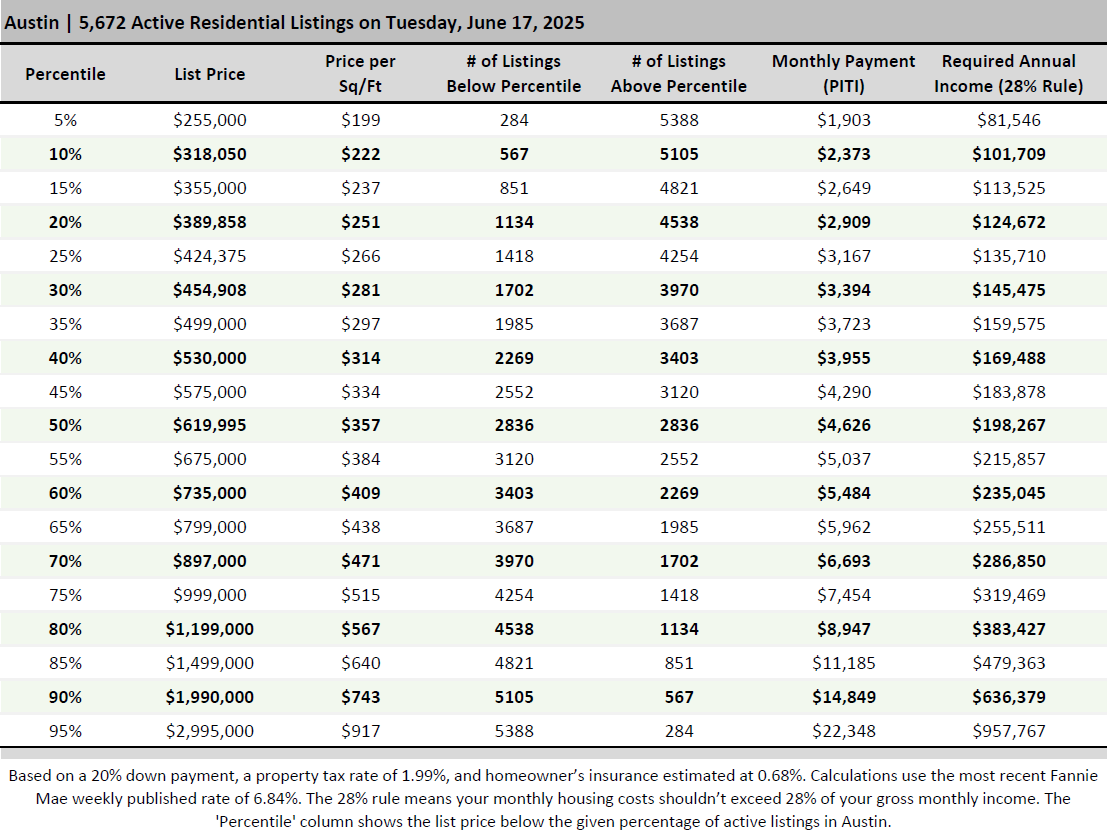
The housing market in Austin spans a wide range of price points, reflecting the city’s diverse neighborhoods and economic opportunities. Based on recent data, home list prices range from $255,000 at the 5th percentile to $2,995,000 at the 95th percentile. The median list price, at the 50th percentile, is $619,995, meaning half of the active listings in Austin are below this price and half are above. This median price translates to a cost of $357 per square foot, indicating the value placed on properties in central or desirable areas. For context, there are 2,836 listings below this median price and an equal number above, out of a total of approximately 5,672 active listings. This broad distribution highlights Austin’s appeal to both entry-level buyers and those seeking luxury properties.
Monthly housing costs in Austin, often referred to as PITI (Principal, Interest, Taxes, and Insurance), vary significantly across percentiles. These costs are calculated assuming a 20% down payment, a 6.84% mortgage interest rate (based on recent Fannie Mae data), a 1.99% property tax rate, and homeowner’s insurance at 0.68% of the list price annually. At the 5th percentile, a home priced at $255,000 results in a monthly PITI of $1,903. For a median home at $619,995, the monthly payment rises to $4,626. At the upper end, a 95th-percentile home listed at $2,995,000 carries a monthly PITI of $22,348. These figures provide a clear benchmark for budgeting, as they account for all major housing-related expenses beyond just the mortgage.
Affordability in Austin is closely tied to income, with the 28% rule serving as a standard guideline. This rule suggests that housing costs (PITI) should not exceed 28% of a household’s gross monthly income. Using this metric, the data reveals the annual income required to afford homes at different price points. For a home at the 5th percentile ($255,000), an annual income of $81,546 is needed, making it accessible to entry-level professionals or smaller households. At the median ($619,995), the required income jumps to $198,267, reflecting the financial commitment needed for a mid-range home. For a luxury home at the 95th percentile ($2,995,000), an income of $957,767 is necessary, underscoring the exclusivity of Austin’s high-end market. These income requirements help prospective buyers gauge whether their earnings align with their housing goals.
Price per square foot is another critical metric for understanding Austin’s housing market. At the lower end (5th percentile), homes cost $199 per square foot, while the median is $357 per square foot. At the 95th percentile, this figure rises to $917 per square foot, indicating premium locations or high-quality properties in areas like downtown Austin or Westlake. This escalation in price per square foot reflects the demand for homes in desirable neighborhoods, where proximity to tech hubs, cultural amenities, or top schools drives value. Buyers can use this data to compare properties and assess whether a home’s size and location justify its cost.
The distribution of listings across percentiles offers insight into market dynamics. At the 5th percentile, only 284 listings are priced below $255,000, indicating limited options for budget-conscious buyers. Conversely, at the 95th percentile, 284 listings are above $2,995,000, catering to a niche market of affluent buyers.
The 25th percentile, with a list price of $424,375 and 1,418 listings below it, represents a more attainable entry point for first-time buyers, with a monthly PITI of $3,167 and a required income of $135,710. At the 75th percentile, a list price of $999,000 corresponds to a monthly PITI of $7,454 and a required income of $319,469, appealing to established professionals or growing families. This spread illustrates the competitive nature of Austin’s market, where options exist for various budgets but require careful financial planning.
For those considering Austin, the data underscores the importance of aligning housing choices with income and lifestyle. A home at the 10th percentile ($318,050) requires an annual income of $101,709 and offers a monthly PITI of $2,373, suitable for young professionals or small families. At the 90th percentile ($1,990,000), the monthly PITI of $14,849 demands an income of $636,379, targeting high-earning individuals or investors. These figures, grounded in a 20% down payment and fixed-rate mortgage assumptions, provide a realistic framework for budgeting in a city where housing costs are a significant portion of living expenses.
Beyond list prices and monthly payments, the data reveals trends in Austin’s housing market. The steady increase in price per square foot across percentiles suggests that higher-priced homes offer more than just size—they often include premium features, better locations, or modern amenities. The relatively high property tax rate of 1.99% and insurance costs of 0.68% also contribute to monthly expenses, particularly for higher-priced homes. For example, at the 85th percentile ($1,499,000), the monthly PITI of $11,185 includes substantial tax and insurance components, reflecting the cost of owning a high-value property in Austin.
This housing data serves as a foundation for understanding Austin’s cost of living, particularly for those prioritizing homeownership. While other expenses like transportation, groceries, and utilities also factor into the overall cost, housing remains the largest financial consideration for most residents. By providing detailed metrics—list prices, price per square foot, monthly PITI, and required incomes—this guide equips prospective buyers with the tools to make informed decisions. Whether targeting an affordable starter home or a luxury property, understanding these figures is crucial for navigating Austin’s competitive housing market.
Frequently Asked Questions
What is the average cost of living in Austin, TX?
The cost of living in Austin varies depending on housing, transportation, and lifestyle factors, with housing being the primary expense. Based on recent housing data, the median home list price in Austin is $619,995, requiring a monthly PITI payment of $4,626 (assuming a 20% down payment, 6.84% mortgage rate, 1.99% property tax, and 0.68% insurance). This translates to a required annual income of $198,267 under the 28% rule, where housing costs should not exceed 28% of gross monthly income. For a more affordable option, homes at the 5th percentile ($255,000) require a monthly PITI of $1,903 and an income of $81,546, while luxury homes at the 95th percentile ($2,995,000) demand a monthly PITI of $22,348 and an income of $957,767. Additional costs like utilities ($150–$200/month), groceries ($200–$300/month), and transportation (gas at $2.15/gallon, insurance at $1,000–$1,200/year) further contribute. Overall, a single person may need $40,000–$60,000 annually to live comfortably, while families may require $80,000–$120,000, depending on housing choices.
What salary do you need to live comfortably in Austin, TX?
To live comfortably in Austin, the required salary depends on housing costs and lifestyle. Using the 28% rule, the median home ($619,995) requires an annual income of $198,267 to cover a monthly PITI of $4,626. For more affordable homes at the 25th percentile ($424,375), an income of $135,710 covers a monthly PITI of $3,167. At the 75th percentile ($999,000), an income of $319,469 is needed for a monthly PITI of $7,454. For renters or those with lower housing costs, a salary of $50,000–$70,000 may suffice for a single person, covering rent ($1,500–$2,000/month for a 1–2 bedroom apartment), utilities, and other expenses. Families typically need $90,000–$150,000 to afford larger homes or rentals, childcare ($800–$1,500/month), and additional costs. Austin’s job market, with an average salary of $70,000–$75,000, supports these ranges for many professionals.
Is Austin, TX expensive to live in?
Austin’s cost of living is above the national average, driven primarily by housing costs, but it remains more affordable than cities like San Francisco or New York. The median home price of $619,995 requires a monthly PITI of $4,626 and an income of $198,267, while homes at the 5th percentile ($255,000) are more accessible with a monthly PITI of $1,903 and an income of $81,546. Price per square foot ranges from $199 at the 5th percentile to $917 at the 95th percentile, reflecting diverse housing options. Other expenses, such as utilities ($170/month on average), groceries ($200–$300/month), and transportation (car insurance at $1,159/year), are closer to national averages. Austin’s 8.25% sales tax and lack of state income tax can offset some costs, but housing remains the key factor making Austin relatively expensive.
How much does it cost to buy a home in Austin, TX?
Home prices in Austin vary widely based on the data provided. The median list price is $619,995, with a monthly PITI of $4,626 (20% down, 6.84% mortgage rate, 1.99% property tax, 0.68% insurance) and a price per square foot of $357. At the 5th percentile, homes cost $255,000, with a monthly PITI of $1,903 and $199 per square foot. At the 25th percentile, homes are $424,375, with a monthly PITI of $3,167 and $266 per square foot. High-end homes at the 95th percentile are $2,995,000, with a monthly PITI of $22,348 and $917 per square foot. Across percentiles, property taxes and insurance add significant costs, particularly for higher-priced homes. Buyers should also consider closing costs (2–5% of the purchase price) and maintenance (1–2% of home value annually).
What are the most affordable neighborhoods in Austin, TX?
While the provided data does not specify neighborhood-level pricing, Austin’s affordability can be inferred from lower-percentile homes. Homes at the 5th–25th percentiles ($255,000–$424,375) are likely found in neighborhoods like Northeast Austin, Southeast Austin, or areas like Dove Springs and Montopolis. These areas offer homes with prices per square foot of $199–$266 and monthly PITI payments of $1,903–$3,167, requiring incomes of $81,546–$135,710. These neighborhoods are farther from downtown but provide access to Austin’s amenities at a lower cost. For comparison, central areas like Downtown or Zilker have higher prices per square foot ($500–$900), aligning with the 80th–95th percentiles ($1,199,000–$2,995,000). Researching specific neighborhoods via local real estate listings can confirm current pricing trends.
Request Info
Have a question about this article or want to learn more?
